Loading...
📮 Get Sabah This Week free every Thursday · what is on across Sabah Subscribe →
🔀 For Everyone

Sabah by Numbers — Complete Statistics & Data Hub (2025)
Last updated: 7 October 2026
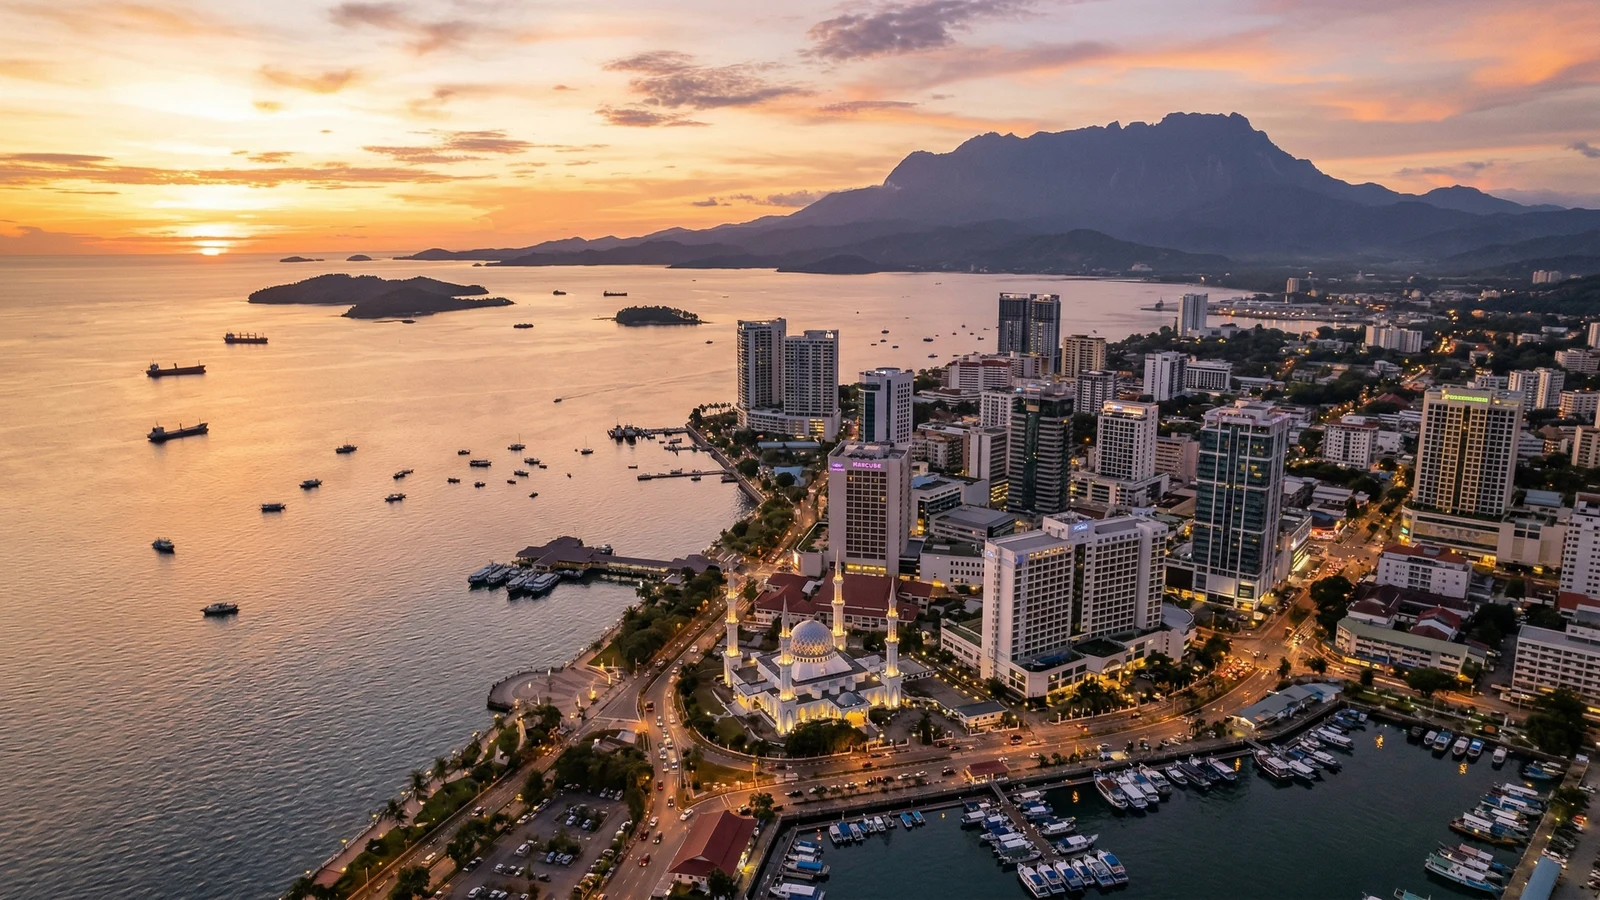
Kota Kinabalu waterfront skyline — Sabah by Numbers statistics hub
👥
3.77M
Population
↑ 2026 DOSM estimate
💰
RM88.8B
GDP
↑ 2025, +5.1% growth
📐
73,631 km²
Land Area
2nd largest state
✈️
RM8.74B
Tourism Revenue
↑ 2025 receipts, +20% YoY
🌿
9
National Parks
30% land protected
🤝
30+
Ethnic Groups
Kadazan, Bajau, Murut…

Sabah is one of Malaysia's most data-rich states — and one of the least documented online. This hub compiles verified statistics from DOSM, the Sabah Tourism Board, PETRONAS, the Sabah Forestry Department, and 40+ primary sources. Every number has a citation. Every page has a "last verified" date.

Browse 32 topic pages below — each with KPI strips, interactive charts, and six-question FAQs. Use our methodology page to understand how the data is sourced, and the sources index for the full bibliography.

Sabah's Population Growth (1970–2026)

From 653,604 at the 1970 census to about 3.75 million in 2025 and 3.77 million in 2026 (OpenDOSM, checked 7 October 2026), almost a sixfold increase.

Sabah Population 1970–2026

What Drives Sabah's RM88.8B Economy?

Services lead at 52.1%, with mining & quarrying (mostly oil and gas) at 22.0% and agriculture at ~14% (2025, DOSM). Tourism — counted within services — contributes 12% of GDP (2024).

Sabah GDP by Sector, 2025

Where the Targets Point: Sabah by 2030

The 13th Malaysia Plan (2026–2030) sets Sabah's GDP to grow 5.8% a year, from RM84.3 billion in 2024 to RM120.1 billion in 2030 (constant 2015 prices), and GDP per capita from RM30,605 to RM48,200. It aims to lift Sabah's median monthly household income from RM4,921 to RM5,780, and to narrow the Central Region's GDP per capita lead over Sabah from 2.4 times to 2.1 times. Status as of September 2026: these are plan targets, and DOSM reported Sabah's growth at 5.1% in 2025. See the economy page and where Sabah is heading, 2026–2040.

Explore All 32 Statistics Pages

Every page includes KPI dashboards, Chart.js visualisations, sourced data, and FAQs.

👥

People & Society

6 pages
3.77M people
Population
District breakdown, growth trends, citizens vs non-citizens
Under 15: 22.9%
Age & Demographics
Age pyramid, sex ratio, urbanisation, household size
14 main indigenous groups
Ethnic Groups
Kadazan-Dusun, Bajau and more, plus Chinese, Malay and others
69.6% Muslim
Religion
Religious composition, history, district-level breakdown
5.7% unemployed
Employment & Labour
Unemployment, median wage and foreign workers
RM3,547 avg spend
Cost of Living
KK vs Tawau vs rural, household expenditure, housing costs
💰

Economy & Industry

11 pages
RM88.8B GDP
Economy Overview
Sector shares, growth trajectory, investment landscape
+5.1% in 2025
GDP & Growth
Real GDP, per capita income, 10-year growth series
1.68M hectares
Palm Oil
Malaysia's largest producer — output, mills, employment
22% of GDP
Oil & Gas
Offshore production, PETRONAS royalties, SOGIP data
RM57.7B exports
Trade
Import/export volumes, top trading partners, commodities
Median RM4,890
Household Income
Income deciles, poverty rate, urban vs rural gaps
400K+ hectares
Agriculture
Rice, cocoa, rubber, timber — beyond palm oil
20,000+ tCO₂e
Carbon Credits
Kuamut, the 2025 carbon laws and the NCA
RM88.8B vs RM153.5B
Sabah vs Sarawak
GDP, income, poverty and industry side by side
22.8% rice
Food Self-Sufficiency
How much of its rice Sabah grows, and the 2030 targets
235,678 tonnes
Fisheries
Marine landings, seaweed, aquaculture and exports
🌿

Nature & Geography

9 pages
73,631 km²
Geography
394 islands, 560km Kinabatangan River, 27 districts
1,931–3,220mm rain
Climate
Monsoon seasons, temperatures, rainfall by region
30% protected
Biodiversity
Endemic wildlife, species counts, conservation status
~10,300 orangutans
Wildlife Populations
Bornean orangutan, pygmy elephant, proboscis monkey trends
30% TPA
Protected Areas
9 national parks, wildlife reserves, marine parks by area
4,095m
Mount Kinabalu
Climber statistics, UNESCO Heritage data, ecology zones
~63.6% forest
Forests
Forest cover, Forest Reserves and forest loss since 1973
600km² coral reefs
Marine & Coral
Sipadan, marine parks, coral cover, fish biomass
394 islands
Islands
Top islands by area, inhabited vs uninhabited, marine parks
✈️

Tourism & Infrastructure

9 pages
3.79M arrivals
Tourism Overview
Top-line metrics, seasonality, contribution to economy
+20.5% YoY 2025
Visitor Arrivals
By country, domestic vs international, monthly trend
RM8.74B
Tourism Revenue
Spending breakdown, per-visitor average, sector contribution
21,651 km road (2020)
Infrastructure
Roads, airports, ports, utilities — overview
7.04M at KKIA, 2023
Airports
Four airports with scheduled flights, routes, capacity
397K TEUs
Ports
Sapangar Bay container throughput, capacity, cruise calls
706km Phase 1
Pan Borneo Highway
Phase progress, completion timeline, economic impact
~52% occupancy
Hotels & Rooms
What is officially published on rooms and occupancy
1,295 government schools
Education
Schools, universities, enrolment, Sabah UMS data
💡 Looking for fun facts?
Visit Did You Know? for Sabah's most surprising statistics — from the rafflesia to the smallest bear on Earth.
ℹ️ About this data
All statistics are sourced from primary Malaysian government agencies (DOSM, KPKT, Sabah Tourism Board, Jabatan Hutan Sabah) and verified as of August 2026. Some figures are DOSM estimates; live population data is fetched from the OpenDOSM API. See our methodology and full source list for details.
📮 Free Weekly Newsletter

Get Sabah This Week, free every Thursday

One short email a week on what's happening around Sabah: events, food, and local life. Free to join, and free to leave whenever you like.

One email a week. Unsubscribe anytime. See what’s inside →