Sabah Economy 2026 — RM84.3B GDP & Key Industries
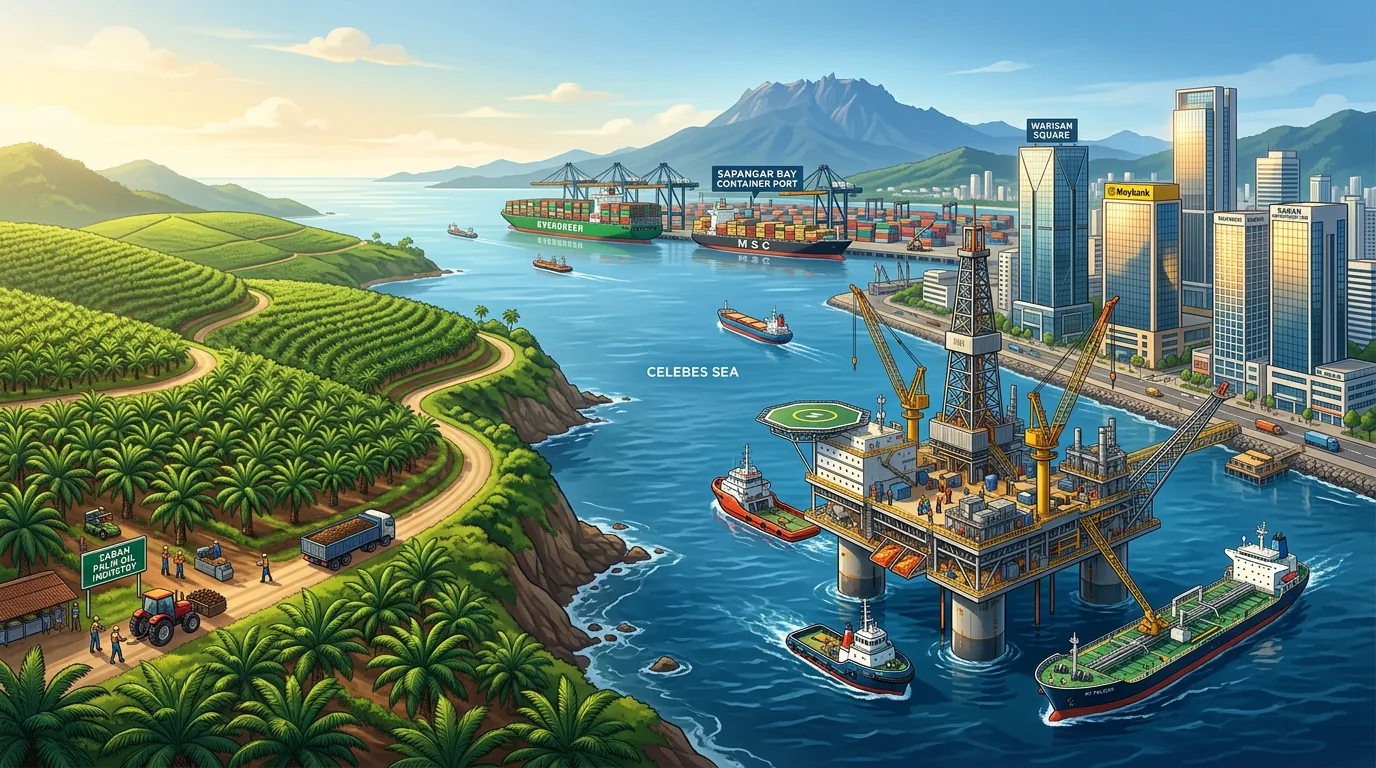
Sabah\u2019s economy produced RM84.3 billion in GDP in 2024, making it Malaysia\u2019s 5th-largest economy. However, per capita GDP is RM22,400 — significantly below the national average — due to a large population and commodity-dependent economic structure. The economy is driven by services (52% of GDP), agriculture including palm oil (20%), and oil & gas (10%).
COVID hit hard in 2020 (−10.6% contraction), followed by commodity-driven rebound in 2021–2022. Growth moderated in 2023–2024 as commodity prices normalized.
Source: DOSM GDP by State 2024
Economic overview
Sabah\u2019s economy is the 5th largest in Malaysia by absolute GDP, but when measured per capita, it lags significantly behind wealthier states like Selangor, Penang, and even Sarawak. This disparity reflects Sabah\u2019s economic structure: it is rich in natural resources but faces structural challenges that limit wealth per person — commodity export-dependence, infrastructure gaps, an underdeveloped manufacturing base, and the loss of skilled workers to Peninsular Malaysia.
The economy contracted sharply during COVID-19 (down 10.6% in 2020), but recovered quickly due to a global commodity boom in 2021–2022. By 2024, GDP reached RM84.3 billion — a post-pandemic high, though growth has moderated to just 1.1% annually as commodity prices normalised. The services sector, driven partly by tourism recovery, is now the primary growth engine.
Economic sectors
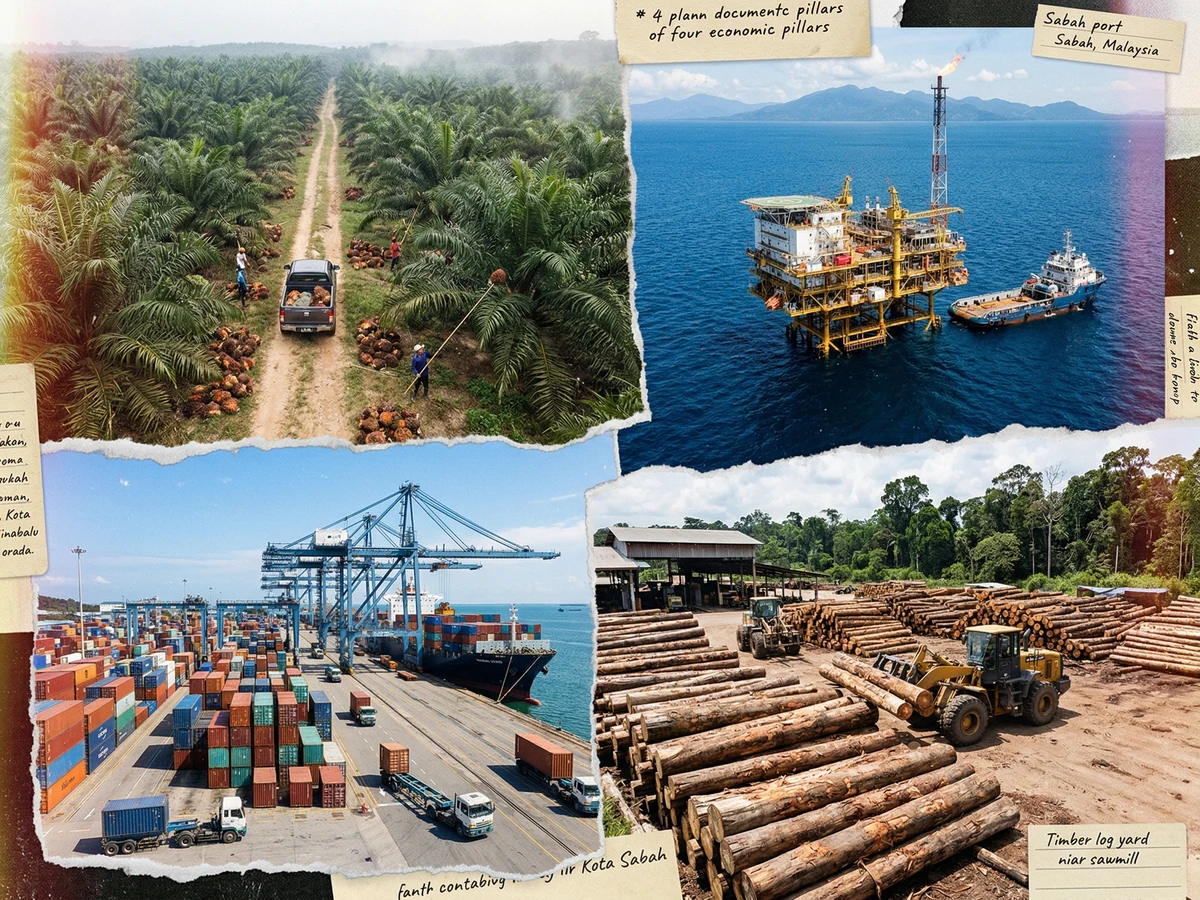
Sabah\u2019s economy is composed of five main sectors, each with distinct characteristics and growth trajectories:
Services dominates but is not a single sector — it includes government, retail, tourism, finance, and transport. Agriculture is heavily dependent on palm oil (about two-thirds of the agricultural share).
Source: DOSM GDP by State 2024
Services (52% of GDP)
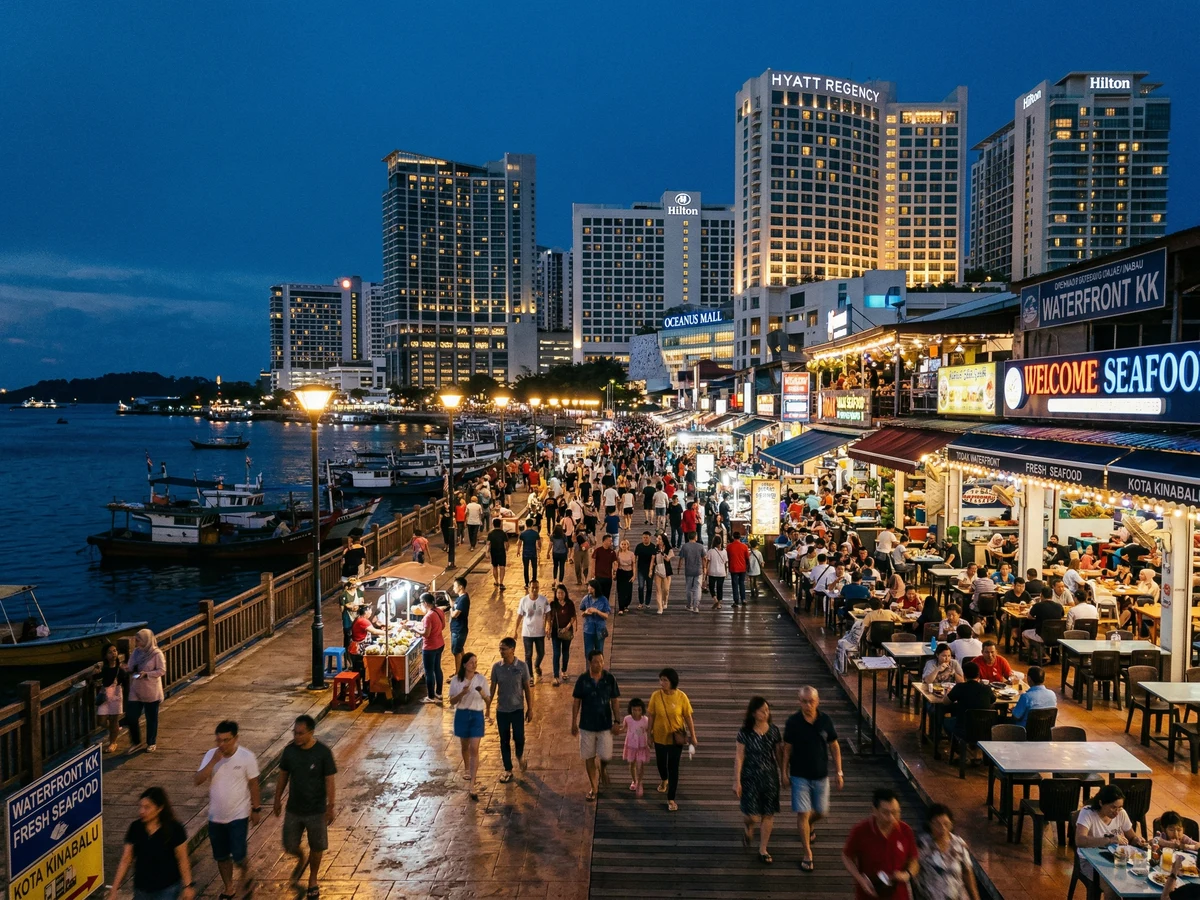
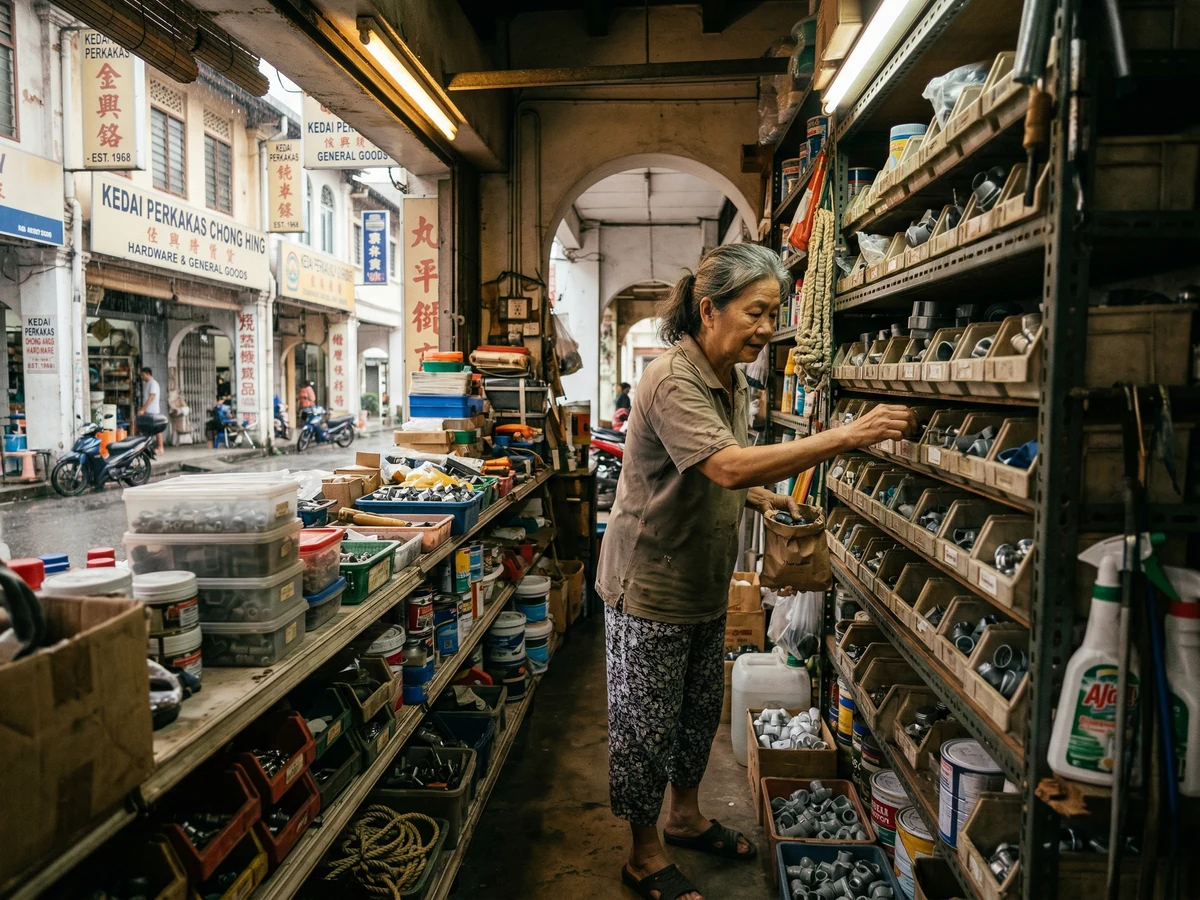
The largest sector, encompassing government, retail and wholesale trade, hospitality and tourism, finance, transport, and telecommunications. Within this, tourism is the growth star — it contributed RM13.7 billion in 2024, up 6.9% year-on-year, and now represents 12% of state GDP. Government services remain large but stable. Retail trade has grown with urbanisation and rising incomes.
Agriculture (20% of GDP)
Dominated by palm oil, which alone accounts for roughly two-thirds of the agricultural share. Other subsectors include cocoa (declining due to age of trees and conversion to palm oil), rubber (stable but low-value), paddy/rice (only 30% self-sufficient), timber (declining due to logging restrictions), and increasingly, aquaculture. Agricultural output contracted 3.4% in 2024 due to lower palm oil and cocoa volumes, offset by gains in forestry.
Manufacturing (14% of GDP)
Modest but growing. Includes palm oil processing mills, wood-based products (plywood, furniture), food and beverage processing, and non-metallic minerals. Manufacturing grew 1.2% in 2024. The sector is constrained by logistics costs, limited skilled labour, and the cabotage policy.
Mining & Petroleum (10% of GDP)
Dominated by offshore oil and natural gas extraction. Sabah produces approximately 40% of Malaysia\u2019s crude oil and 20% of natural gas. Recent growth has been minimal (0.9% in 2024) due to declining onshore production, though major projects like PFLNG 3 (targeting 2H 2027) and Shell\u2019s deepwater developments will support future growth.
Construction (4% of GDP)
A volatile sector that surged 18.8% in 2024, driven by infrastructure projects (Pan Borneo Highway, port expansions) and property development. Growth is cyclical and often project-dependent rather than structural.
Sabah versus other Malaysian states
Sabah ranks 5th by absolute GDP but much lower by per capita measures. The comparison below shows the gap between Malaysia\u2019s largest economies and the Sabah:
Selangor’s economy is 4.1x larger than Sabah. Sarawak, with similar natural resources, has a larger economy despite a smaller population, reflecting more efficient resource management and lower poverty.
Source: DOSM GDP by State 2024
Key economic challenges
Despite natural wealth, Sabah faces structural headwinds that suppress per capita income and growth:
- Commodity dependence: Over 70% of exports are palm oil and petroleum. Price volatility creates boom-bust cycles. The 2023 correction knocked 7.5% off GDP as commodity prices fell.
- Limited value-added processing: Most palm oil is exported crude; oil and gas extraction is capital-intensive with limited local employment. Manufacturing is underdeveloped.
- Infrastructure gaps: Roads, ports, and utilities lag Peninsular Malaysia, raising business costs. The Pan Borneo Highway is addressing this but completion is still years away.
- Brain drain: Educated Sabahans migrate to Kuala Lumpur or Singapore for better-paying jobs, starving the state of local talent and entrepreneurship.
- Cabotage policy: Federal law requires goods shipped between Malaysian ports to use Malaysian-flagged vessels, raising shipping costs for Sabah (and Sarawak) by 15–20% relative to Peninsular ports.
- Large informal economy: Subsistence farming, informal trade, and cross-border commerce don\u2019t register in official GDP, understating true economic activity but also indicating low productivity.
Current growth drivers
Tourism is the bright spot. International arrivals surpassed 3.79 million in 2025, up from 2.4 million pre-COVID. Tourism revenue hit RM13.7 billion in 2024, a 40% jump from 2020. This has created jobs in hotels, restaurants, transport, and guides, and is attracting infrastructure investment.
Oil & gas projects provide another medium-term boost. PFLNG 3 (floating LNG, capacity 2.0 million tonnes/year) targets 2027 commissioning at an estimated investment of RM4.6 billion. Shell\u2019s deepwater projects added 21,000 barrels of oil equivalent per day in 2024.
Infrastructure development — Pan Borneo Highway, port expansions, and utility upgrades — is creating construction jobs and lowering logistics costs, benefiting all sectors.
However, these gains remain modest relative to overall economic size, and are heavily dependent on commodity prices and external investment.
Frequently asked questions
Q What is Sabah's GDP ranking among Malaysian states?
Q Why is Sabah's GDP per capita so low despite natural resources?
Q What is the biggest employer in Sabah?
Q Is Sabah attracting foreign direct investment (FDI)?
Q How is Sabah's economy transforming?
Q How badly did COVID-19 hit Sabah's economy?
Q What is Sabah's economic outlook for 2025–2030?
Sources & References 7 sources
Last verified: 11 April 2026
Government — DOSM
- DOSM GDP by State 2024 (released July 2025) Official state GDP breakdown by sector and growth rates
- OpenDOSM GDP Dashboard Interactive dashboard with historical and projected GDP data
- DOSM Poverty Survey 2024 State-level poverty rates and household income data
- DOSM Labour Force Survey 2024 Employment by sector and unemployment rates