Sabah GDP 2026 — RM84.3B by Sector & District

Sabah\u2019s GDP is RM84.3 billion in 2024, growing at 1.1% annually. The economy is dominated by services (52%), agriculture including palm oil (20%), and oil & gas (10%). Per capita GDP is RM22,400 — among the lowest in Malaysia — due to commodity export dependence and limited domestic value-added industries.
Growth was volatile: steady 4–6% pre-COVID, sharp −5.6% contraction in 2020, strong rebound 6–9% in 2021–2022, moderation to 5–6% in 2023–2024 as commodity prices normalised.
Source: DOSM GDP by State 2024
What is GDP and why it matters for Sabah
Gross Domestic Product (GDP) is the total value of all goods and services produced within Sabah in a year. It is the primary measure of economic size and capacity. Sabah\u2019s RM84.3 billion GDP (2024) ranks it 5th among Malaysian states, but when divided by population (3.76 million), per capita GDP is just RM22,400 — significantly lower than Selangor (RM48,000+) or Penang (RM38,000+).
This gap tells a crucial story: Sabah is resource-rich but income-poor. The state exports vast quantities of palm oil and petroleum, but much of the profit flows to federal entities (PETRONAS), multinational corporations, or is captured by a small elite. The bulk of Sabahans earn modest incomes in services, agriculture, or informal employment.
Sectoral breakdown and growth drivers
Sabah\u2019s economy is organised into five main sectors. Understanding their relative size and growth trajectories is key to anticipating economic trends:
Within services, retail/wholesale and government are the largest. Within agriculture, oil palm dominates. 'Other' includes tourism, education, healthcare, and numerous small subsectors.
Source: DOSM GDP by State 2024 aggregated
Services Sector (52% of GDP) — The Growth Engine
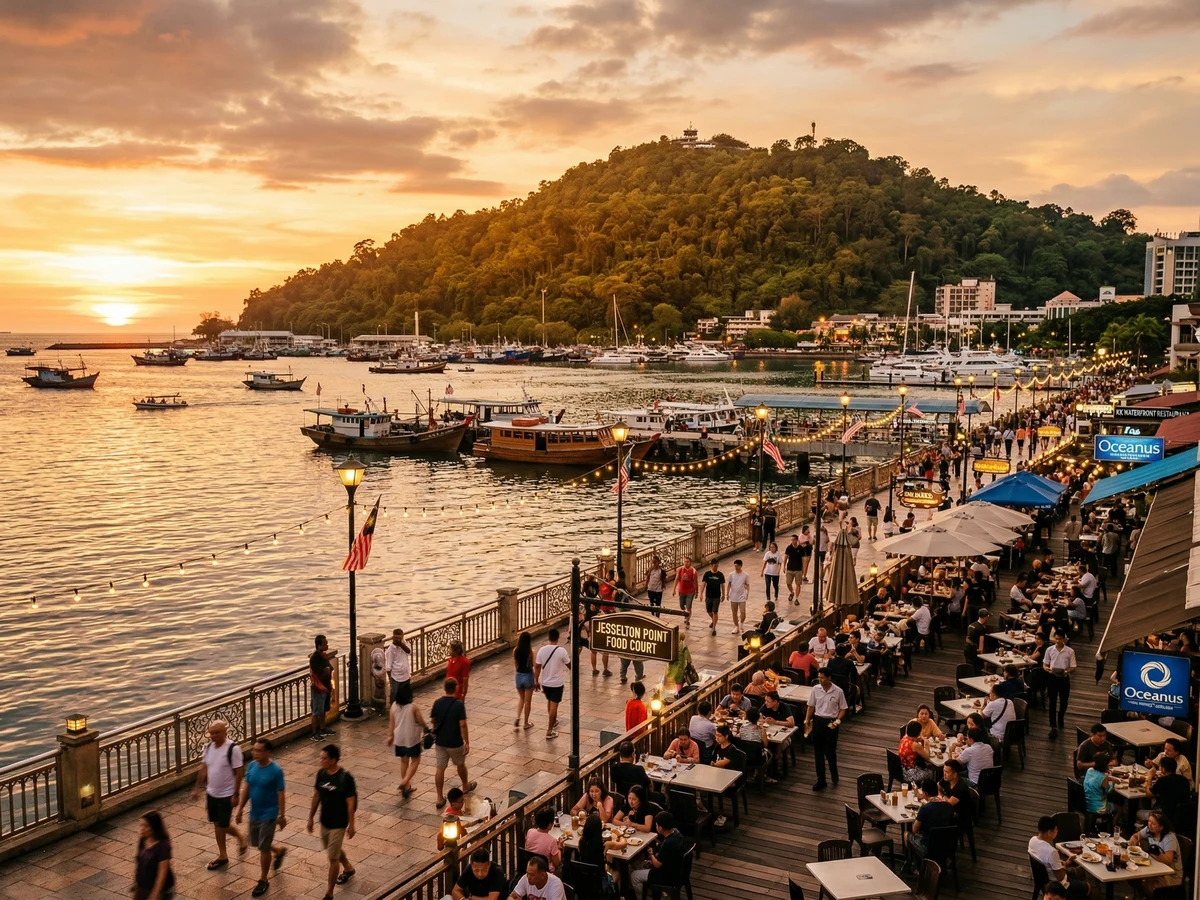
Services encompass government, retail and wholesale trade, hospitality, finance, transport, and telecommunications. It is Sabah\u2019s largest sector and now the primary growth driver, expanding 4.2% in 2024. Within services, the standout is tourism and hospitality, which surged 6.9% and now contributes RM13.7 billion annually. International visitor arrivals hit 3.79 million in 2025, up 58% from the 2020 COVID low.
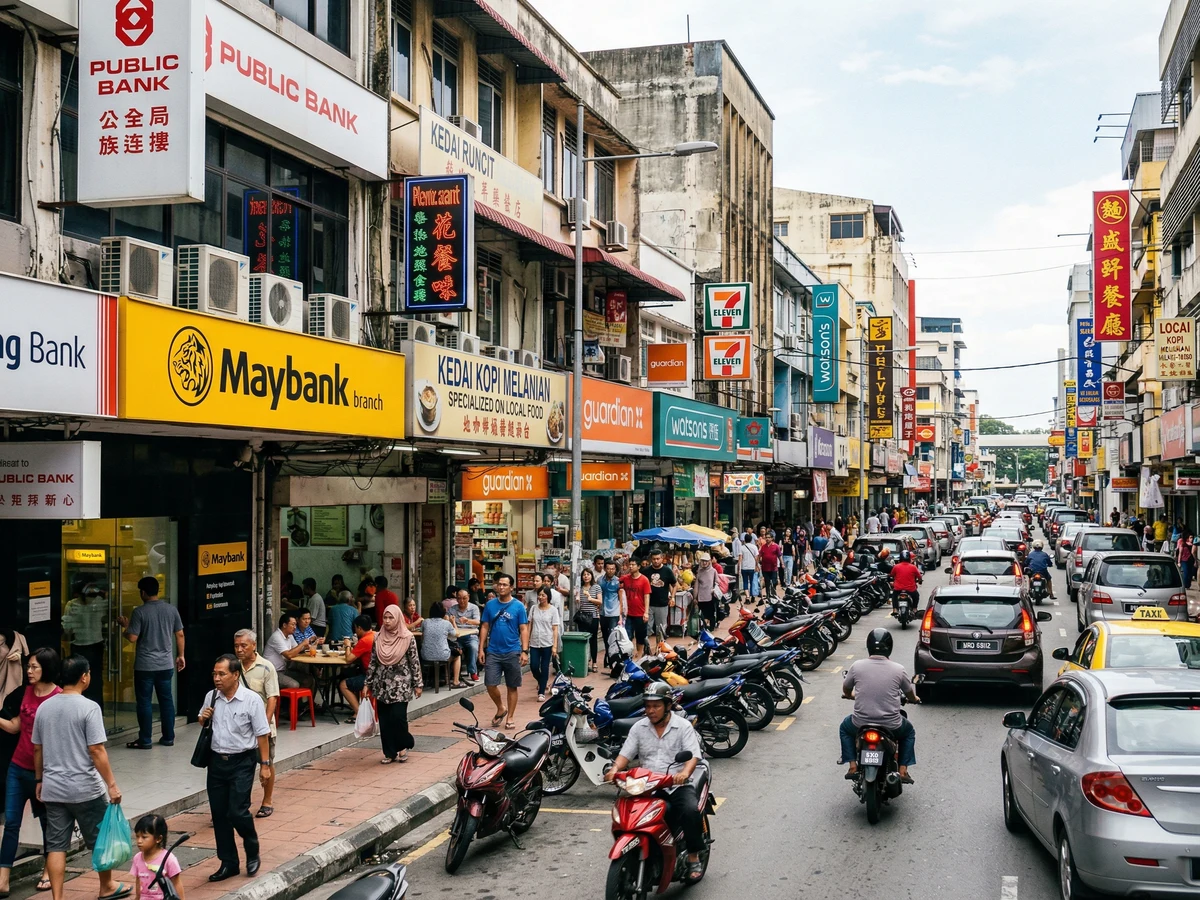
Government services (federal and state payroll, administration) remain large but are relatively stagnant — growth is constrained by budget cycles rather than economic dynamism. Retail trade is growing modestly as urbanisation continues and consumer incomes rise.
Agriculture Sector (20% of GDP) — Volatile and Declining
Dominated by palm oil (~11% of state GDP), with smaller contributions from cocoa, rubber, paddy/rice, timber, and aquaculture. Agriculture contracted 3.4% in 2024 due to lower palm and cocoa volumes. Palm oil output has stabilised at ~4.8 million tonnes per year, but replanting of old palm plantations is lagging, and conversion to other crops is slow.
Cocoa production has fallen from 40,000 tonnes (2010s) to ~22,000 tonnes today, as trees age and farmers switch to the higher-margin palm oil. Paddy production remains around 100,000–120,000 tonnes annually, but Sabah imports ~70% of its rice — an ongoing food security concern.
Manufacturing Sector (14% of GDP) — Underdeveloped
Manufacturing is limited to palm oil processing mills, basic wood products, food and beverage processing, and non-metallic minerals. The sector grew 1.2% in 2024 — sluggish. Sabah lacks a robust industrial base, partly due to high logistics costs (cabotage policy) and competition with Peninsular manufacturers.
Mining & Quarrying (10% of GDP) — Petroleum-Dependent
Dominated by offshore oil and natural gas extraction. Sabah produces ~200,000 barrels per day (40% of Malaysia\u2019s total) and ~1,400 MMscf per day of natural gas (20% of Malaysia\u2019s total). However, onshore production is declining, and growth is minimal (0.9% in 2024). Future growth depends on major projects: Shell\u2019s deepwater work (21,000 boepd added in 2024) and PETRONAS\u2019s PFLNG 3 floating LNG plant, targeting 2H 2027 commissioning.
Construction (4% of GDP) — Cyclical and Project-Driven
Construction surged 18.8% in 2024, driven by Pan Borneo Highway expansion, port upgrades, and real estate development. However, this sector is volatile — growth depends on government budget allocation and private investment cycles, not underlying economic fundamentals.
Economic output by district (illustrative)
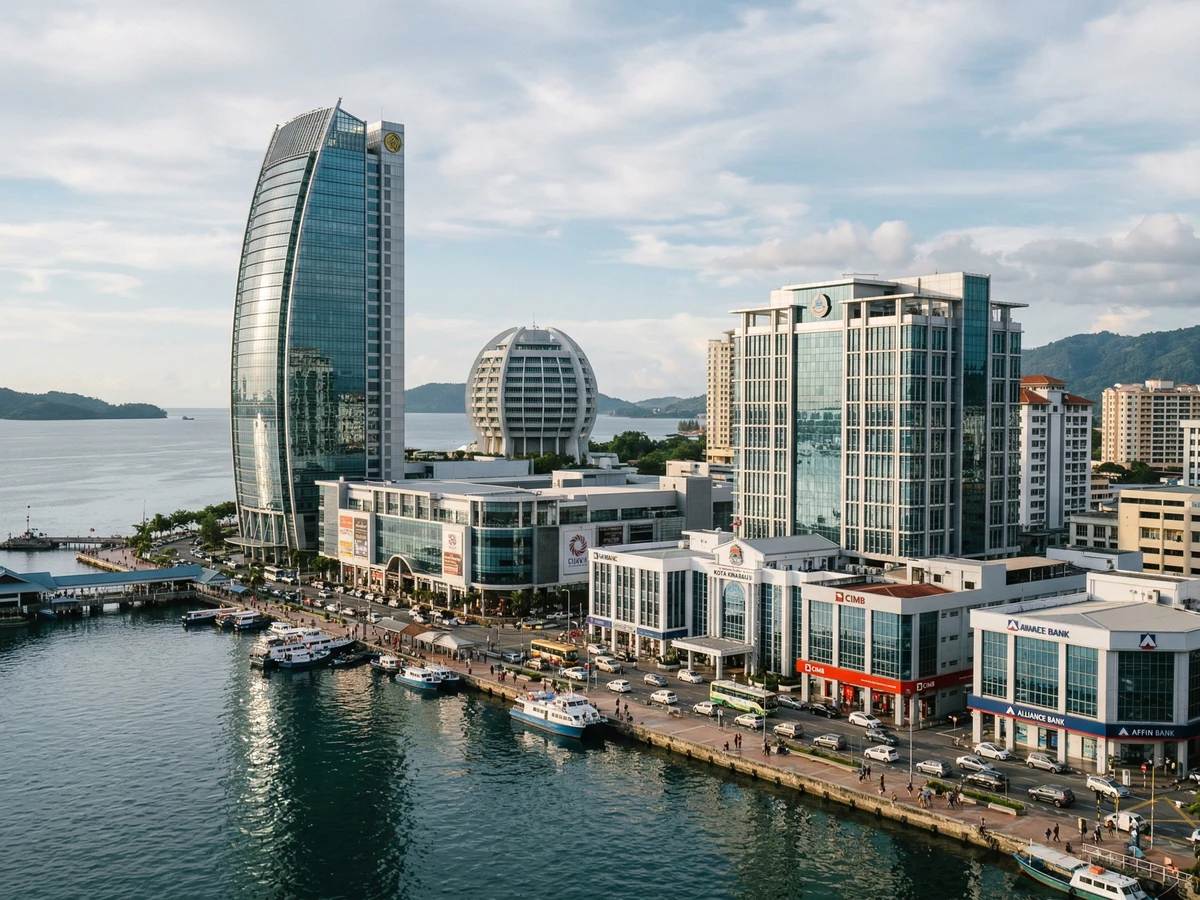
Economic activity is highly concentrated geographically. Kota Kinabalu alone accounts for roughly 18% of state GDP due to its role as the capital, main port, tourism hub, and financial centre. The next three largest — Tawau, Sandakan, and Lahad Datu — are centres for agricultural processing and trade.
These are approximate estimates based on economic concentration. Official district-level GDP is not separately published by DOSM, so these figures are derived from industry location data and population proportions.
Source: SEDIA & DOSM data aggregated
The interior districts (Pensiangan, Nabawan, Tongod, Kundasang) are sparsely populated and contribute little to formal GDP, though subsistence farming and informal trade are significant to local livelihoods.
Sabah vs Sarawak: A regional comparison
Sarawak, Malaysia\u2019s other major East Malaysian state, has a larger economy (RM130B vs RM84.3B) despite similar population size and natural resource endowments. Key differences:
- Manufacturing base: Sarawak has petrochemical plants, cement factories, and aluminium smelting. Sabah has mainly commodity processing.
- Infrastructure: Sarawak has invested heavily in ports (Kuching, Sibu, Bintulu) and highways, lowering logistics costs relative to Sabah.
- Fiscal autonomy: Sarawak retained stronger control over oil royalties and state finance under Malaysia Agreement 1963. This funded more development infrastructure.
- Poverty: Sarawak\u2019s poverty rate (6.8%) is below Sabah\u2019s (7.4%), suggesting more inclusive growth.
Sabah could improve GDP growth and per capita income by adopting a Sarawak-style model: prioritise downstream industrialisation, invest in port infrastructure, and negotiate higher oil royalty retention.
Frequently asked questions
Q What drives Sabah's GDP growth?
Q Why is Sabah's GDP per capita lower than the national average?
Q Is oil and gas bigger than palm oil for Sabah's economy?
Q What sectors are driving services growth?
Q How does Sabah's economic growth compare to Sarawak?
Q What does a 2.5% projected growth for 2025 mean for Sabahans?
Sources & References 4 sources
Last verified: 11 April 2026