Sabah Trade Statistics 2026 — Exports, Imports & Partners

Sabah\u2019s total international trade in 2024 was RM107.8 billion — exports RM61.3B, imports RM46.4B, yielding a trade surplus of RM14.9 billion. Top exports: crude petroleum (35%), palm oil (28%), and LNG (7.5%). Top partners: China, India, European Union, and Japan. Sabah\u2019s trade is heavily commodity-dependent and vulnerable to global price fluctuations.
Three commodities — crude petroleum, palm oil, and LNG — account for 70.4% of all exports. Dependence on commodities creates vulnerability to price shocks.
Source: DOSM Sabah External Trade 2024
Trade profile and structure
Sabah is a commodity export economy with a modest but growing services export base (tourism). The state runs a consistent trade surplus, reflecting its abundant natural resources and limited domestic manufacturing. However, this trade surplus masks structural challenges: the economy imports nearly all processed goods, machinery, and consumer products, and is vulnerable to global commodity price cycles.
Sabah\u2019s main trade partners are all large economies with strong demand for commodities: China, India, Japan, South Korea, and the European Union. Trade with smaller neighbouring economies (Brunei, Indonesia) is limited, partly due to Malaysia\u2019s protectionist policies and cabotage restrictions on shipping.
Export structure and commodities
Total exports (2024): RM61.3 billion — down 2.3% from 2023, reflecting lower commodity prices and volumes.
Crude Petroleum (35% of exports, RM21.3B)
Sabah\u2019s largest single export commodity. Exported to China (~40%), India (~25%), Japan (~15%), and others at global benchmark prices (Brent crude). Price volatility is the primary driver of export value swings. A US$10/barrel price change affects export revenues by roughly RM2–3 billion annually.
Palm Oil & Products (28% of exports, RM17.3B)
Second-largest export. Includes crude palm oil (CPO), palm kernel oil, and refined products. Shipped to India (largest importer, ~25%), China (~20%), European Union (~15%), and others. Markets are more stable than oil but subject to currency fluctuations and trade disputes (some countries restrict imports due to sustainability concerns).
Liquefied Natural Gas (7.5% of exports, RM4.6B)
Growing export category. Produced by floating LNG vessels and exported to Japan (~35%), South Korea (~25%), Taiwan (~20%), and others in East Asia. LNG markets are integrated with global energy markets but have longer-term contracts, providing some price stability.
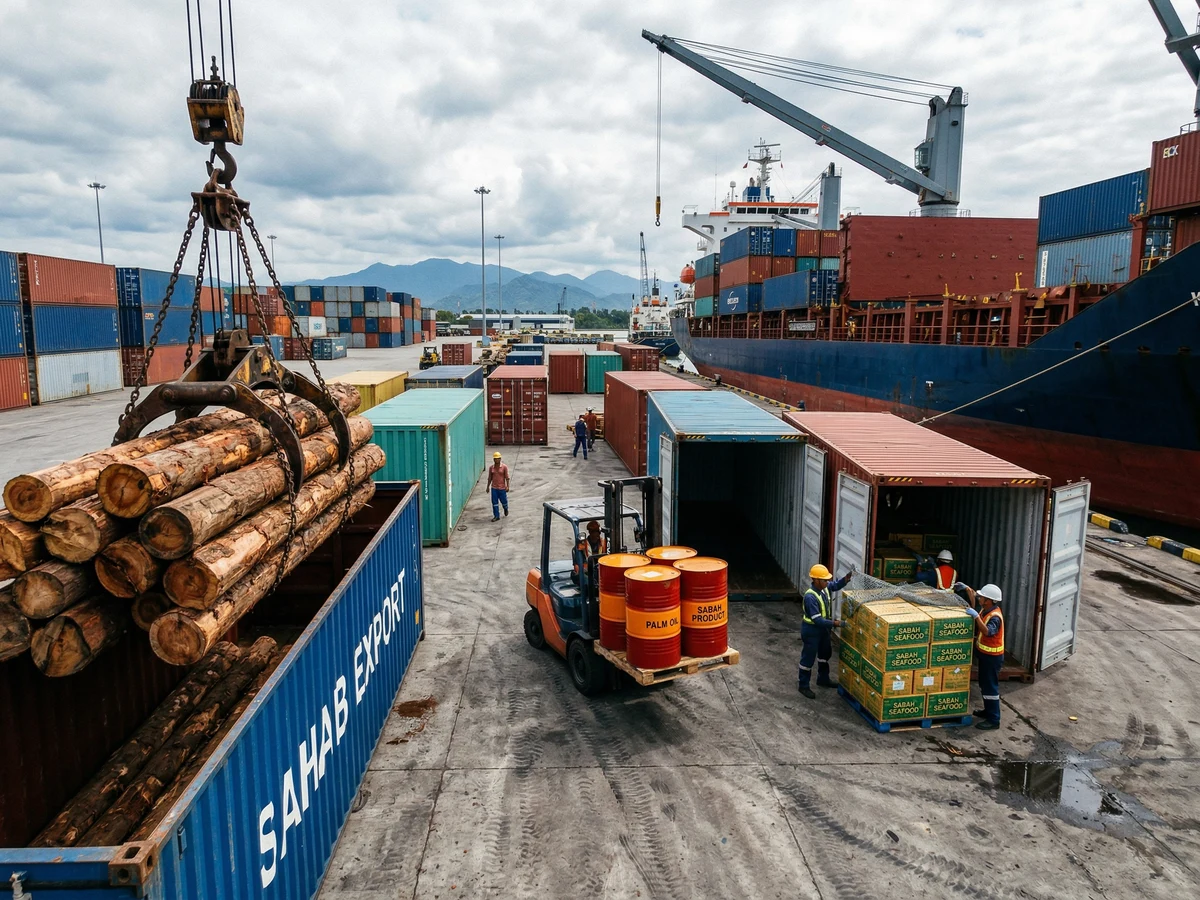
Timber & Wood Products (~3%, RM~2B)
Collapsed from historical levels (~RM5–6B in the 1990s) due to sustainability concerns, logging moratorium, and declining global demand for tropical hardwoods. Remaining exports are mostly sawn timber, plywood, and specialty products, with minimal value growth prospects.
Seafood & Aquaculture (~2%, RM~1.2B)
Growing but modest. Includes fresh and frozen fish, shrimp, and seaweed. Markets are mainly Singapore, Japan, and regional processors. Aquaculture growth (tiger grouper, seabass, shrimp) is expanding production and export potential.
China is the largest single partner, but Sabah exports are distributed across multiple buyers, reducing over-reliance on any single market. Diversification has improved over the past decade.
Source: DOSM Sabah External Trade 2024
Imports and trade balance
Total imports (2024): RM46.4 billion — up 10.2% from 2023.
Top import categories:
- Refined petroleum products (~RM5.2B) — refined fuel, diesel, petrol for transport and power generation. Mostly from Singapore and Malaysia refineries.
- Machinery and equipment (~RM4B) — industrial machinery, computers, electronic equipment. From China, Japan, Germany.
- Vehicles and parts (~RM2.5B) — cars, trucks, motorcycles, spare parts. From Japan, Thailand, Malaysia.
- Chemicals and fertilisers (~RM1.5B) — mainly inorganic fertilisers for palm oil, from China and India.
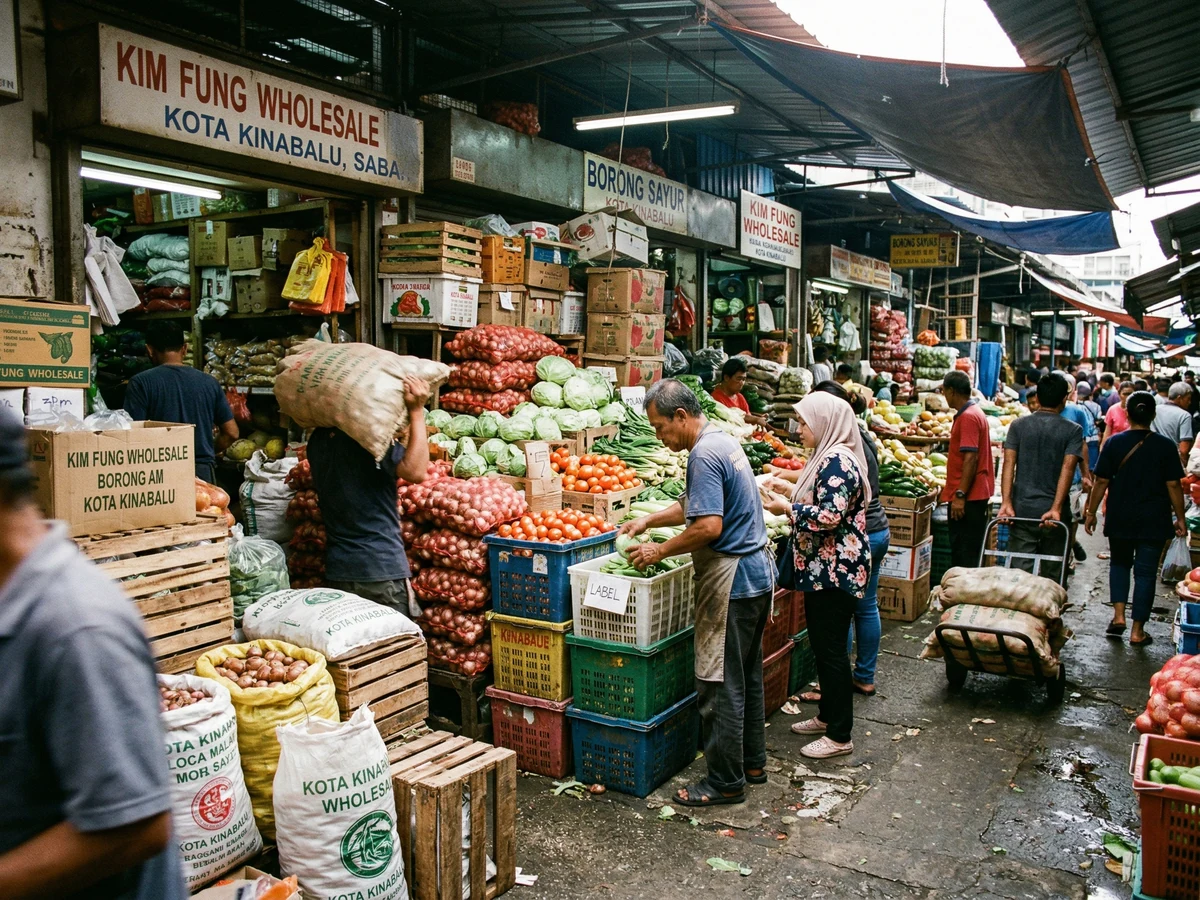
- Food and consumer goods (~RM2B) — rice, food products, textiles, consumer goods. From Malaysia, Thailand, Singapore, China.
Imports reflect Sabah\u2019s limited manufacturing base and reliance on Peninsular Malaysia and external suppliers for almost all processed goods. The large import growth (10.2% YoY) reflects rising commodity input costs and increased capital goods imports for infrastructure projects.
Trade trends and volatility
Sabah\u2019s trade is highly volatile due to commodity price dependence. Year-to-year swings of 15–20% are common:
Trade collapsed in 2020 (COVID), surged in 2022 (commodity boom), then moderated in 2023–2024. Total trade and exports remain well above pre-2022 levels but below the 2022 peak.
Source: DOSM Sabah External Trade
2020: COVID collapse
Total trade fell to RM78.5B (−18% from 2019) as global demand collapsed, shipping disruptions occurred, and commodity prices plummeted.
2021–2022: Commodity boom
Trade rebounded sharply to RM120.3B in 2022 as: (1) global economic recovery; (2) oil and gas prices surged; (3) palm oil prices spiked (US$1600+/tonne at peak). Export revenues were abnormally high, funding exceptional state government spending and development projects.
2023–2024: Normalization
Trade moderated to RM107.8B as commodity prices normalised. However, 2024 trade remains ~12% above pre-2022 levels, reflecting sustained global demand and structural economic growth beyond the commodity boom.
Trade challenges and opportunities
Commodity price volatility: Sabah\u2019s trade and government revenues are at the mercy of global markets. A sustained commodity downturn would be economically disruptive.
Cabotage policy: Mandatory use of Malaysian-flagged vessels increases shipping costs, making Sabah\u2019s exports less price-competitive and imports more expensive.
Limited export diversification: Dependence on three commodities (oil, palm, LNG) limits resilience. Building a manufacturing base for value-added processing would reduce vulnerability.
Trade facilitation: Sepanggar port is the main gateway; recent upgrades have improved throughput. Further improvements in port efficiency and logistics would reduce trade costs and support export competitiveness.
Frequently asked questions
Q What are Sabah's main exports?
Q Why does Sabah depend so heavily on China?
Q Is the timber export decline permanent?
Q What does Sabah import and from where?
Q How does the cabotage policy affect Sabah's trade costs?
Q What is the outlook for Sabah's trade balance?
Sources & References 6 sources
Last verified: 11 April 2026