Sabah Tourism Revenue 2026 — RM8.74B Breakdown

Sabah generated RM8.74 billion in tourism revenue in 2025, an increase of 20% year-over-year. The average spend per visitor is RM2,306. Accommodation (32%), food and beverage (25%), and activities (20%) account for 77% of spending. International visitors spend RM3,800 per trip (3x more than domestic visitors). Tourism now represents 12% of Sabah\u2019s GDP and employs 387,600 people.
Sabah’s tourism revenue crashed 78% in 2020, bottomed in 2021, and fully recovered by 2025 — now exceeding pre-pandemic levels.
Source: Sabah Tourism Board & DOSM
Revenue Overview
Sabah\u2019s tourism revenue of RM8.74 billion in 2025 represents full recovery and growth beyond pre-pandemic levels. The 20% year-over-year increase reflects both higher visitor volume (3.79 million, +20.8% vs 2024) and improved spending per visitor (RM2,306, +1.3% vs 2024). This combination signals both recovery momentum and improving destination premium positioning.
The revenue figure captures direct tourism receipts reported by the Sabah Tourism Board. DOSM\u2019s broader Tourism Satellite Account, which includes indirect spending (supply chain, wages, reinvestment), estimates total internal tourism consumption at RM13.7 billion in 2024 — meaning every RM1 of direct tourism spending generates RM0.57 of indirect economic activity.
Revenue Breakdown by Category
Tourism spending in Sabah follows a predictable pattern across major categories, with accommodation and F&B dominating. Understanding this breakdown is key for policy and investment decisions.
Accommodation generates the highest share, followed by dining and activities. These three categories account for 77% of total spending.
Source: Sabah Tourism Board breakdown
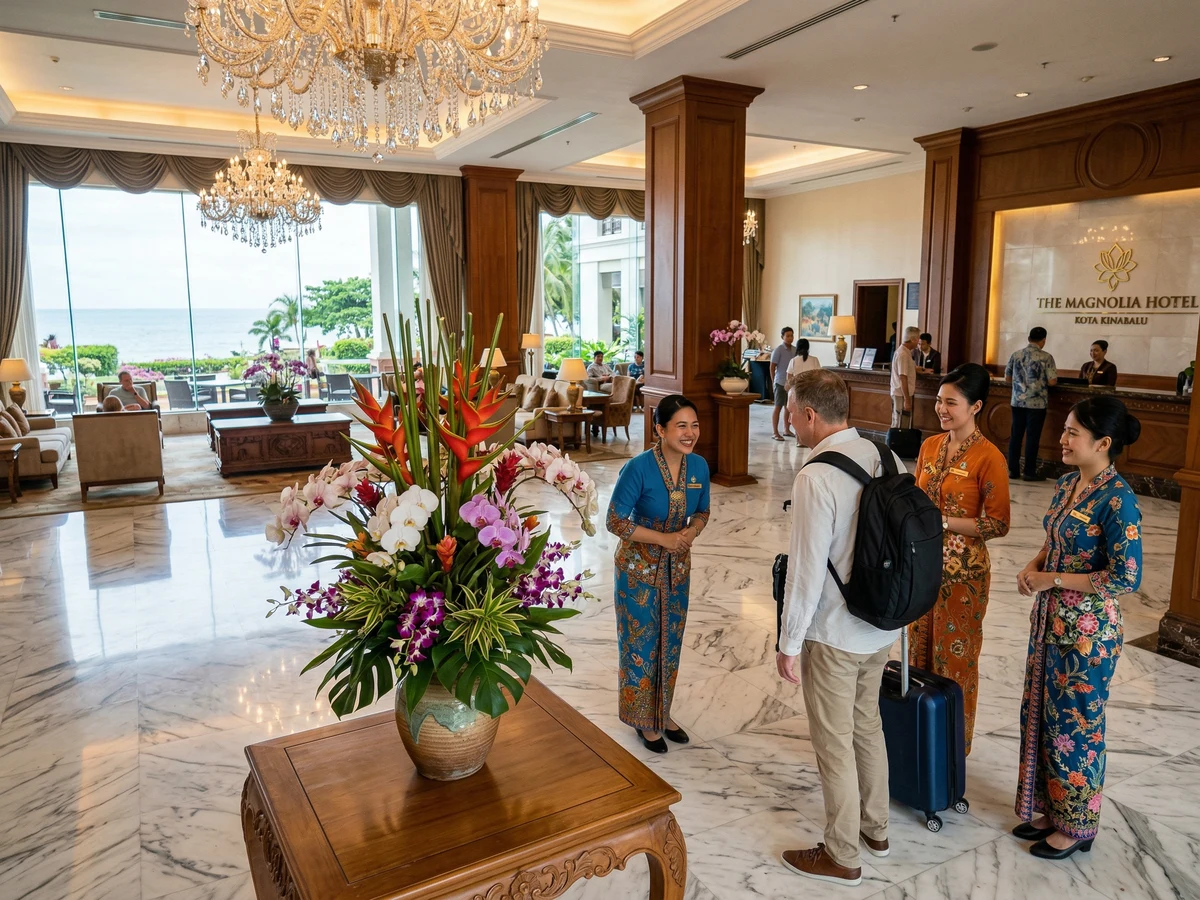
Accommodation (32%, ~RM2.8B): Hotels, resorts, guesthouses, and homestays. KKIA averages ~RM250–500/night (3–4 star); luxury resorts command RM600–1,500+/night. Average occupancy of 72% indicates healthy demand with pricing power.
Food & Beverage (25%, ~RM2.2B): All dining — from street food (RM5–20/meal) to fine dining (RM100–300+/meal). International visitors spend 3–4x more on F&B than domestic; premium F&B is a significant opportunity for revenue growth.
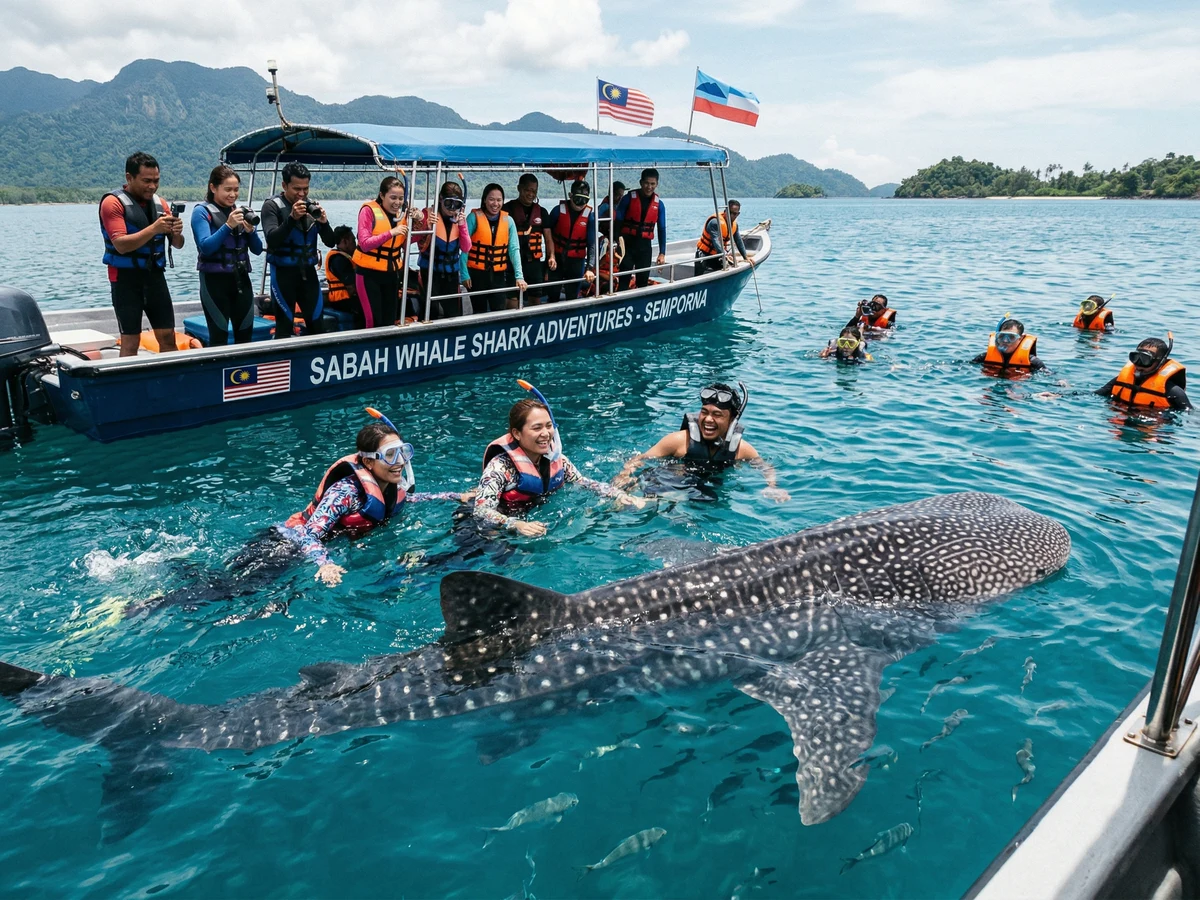
Activities (20%, ~RM1.75B): Mount Kinabalu climbs, Sipadan diving, river safaris, guides, entry fees, transport services. Premium packages (dive liveaboards, private climbs) command RM2,000–5,000+; this is the highest-growth category.
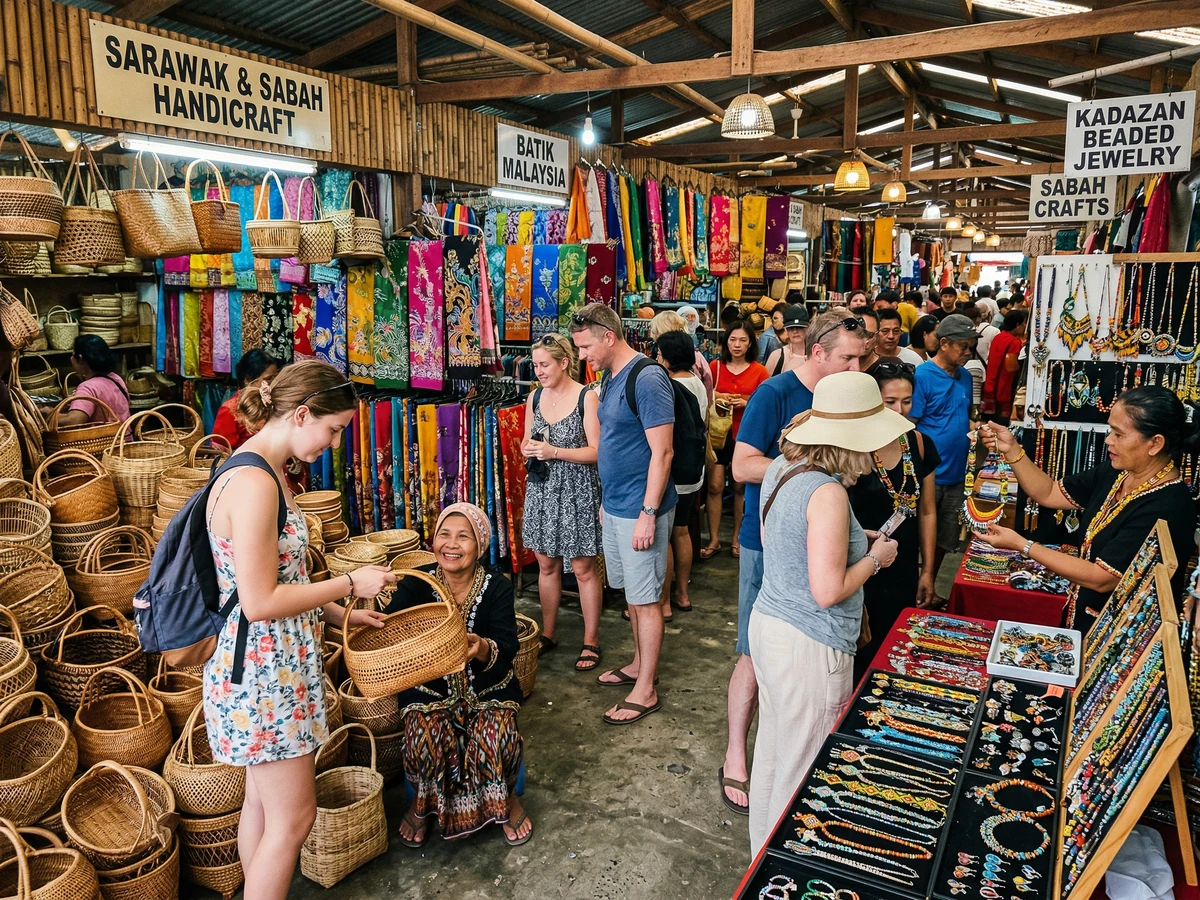
Shopping (13%, ~RM1.1B): Souvenirs, handicrafts, retail goods. Night markets and duty-free shops in KK drive volume; e-commerce is cannibalizing some retail.
Transport (10%, ~RM875M): Domestic flights, taxis, car rentals, boat charters. Local transport spending is often overlooked but provides steady income.
Revenue by Source Market
International visitors generate higher revenue per capita than domestic visitors, despite lower volume. This is because international travelers spend more on accommodation, dining, and premium activities. The top 5 source markets (China, Singapore, South Korea, Taiwan, Indonesia) generate approximately 45% of international tourism revenue.
Despite comprising only 40% of arrivals, international visitors account for 51% of revenue due to higher per-visitor spending (RM3,800 vs RM1,200).
Source: Sabah Tourism Board
Spending Patterns: International vs Domestic
International visitors (RM3,800 avg): Spend more on accommodation (40% of budget), premium dining (20%), activities (25%), and shopping (15%). They stay longer (5–7 nights average), book packages, and participate in high-cost adventures (diving, mountain climbing).
Domestic visitors (RM1,200 avg): Focus on budget accommodation (25% of budget), casual dining (30%), activities (30%), and shopping (15%). They stay shorter (2–3 nights), prefer day trips, and seek value experiences. Weekend getaway-focused.
By nationality: Chinese tourists spend highest (RM4,500–5,000 per trip, luxury resorts + high-end dining). Australian, British, and European tourists spend RM3,500–4,000 (adventure activities). Southeast Asian tourists spend RM2,000–2,500 (business + leisure mix).
Employment & Multiplier Effects
Tourism is a significant employment engine. The sector directly employed 387,600 people in 2024, up 6.9% from 362,700 in 2023. Employment growth outpaced visitor growth, indicating either sector expansion or wage pressures. Key job categories: accommodation and food services (largest), retail trade, transportation, and guides/tour operators.
The multiplier effect means every tourism job supports ~1.5–2.0 indirect jobs in supply chains (food suppliers, laundry, transport, construction). Total tourism-induced employment (direct + indirect) is estimated at 550,000–650,000 people, or ~15–18% of Sabah\u2019s workforce.
Frequently asked questions
Q How does Sabah's RM8.74B tourism revenue compare to Langkawi or Penang?
Q What are tourists spending most on in Sabah?
Q How can Sabah increase revenue per visitor?
Q What is MICE tourism and how much does it contribute?
Q Do eco-tourism and cultural tourism command premium pricing?
Q How much does heritage tourism contribute to Sabah revenue?
Q What employment does tourism generate in Sabah?
Sources & References 7 sources
Last verified: 11 April 2026